Cortical Dynamics in Mouse Behavior Using Widefield Calcium Imaging – Part One
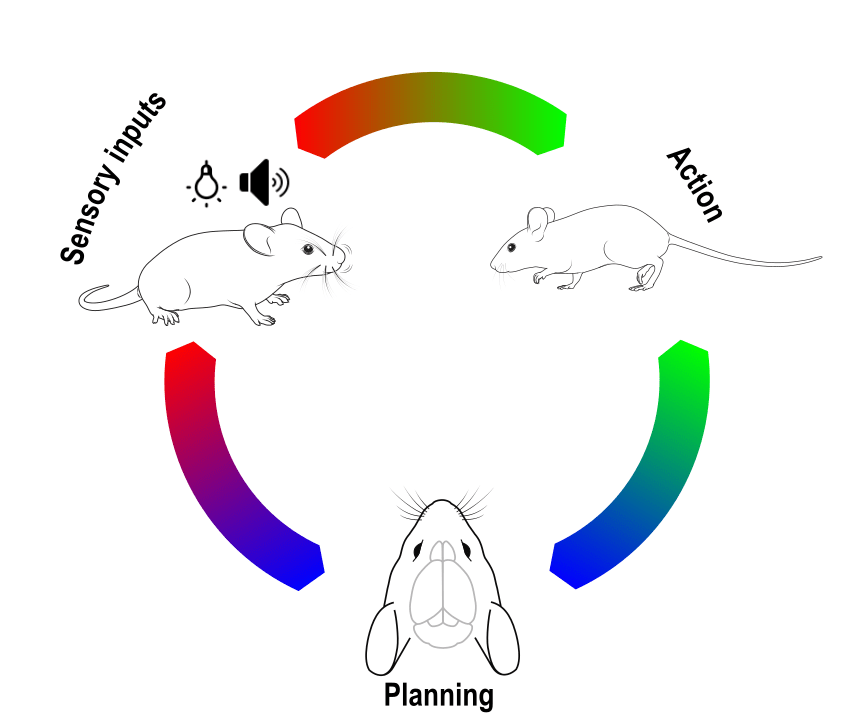
The mouse cortex is a complex structure segmented into distinct regions, each specialized in processing sensory information, motor planning, execution etc. These functional modules are highly interconnected and work together to allow the animal to interact with its environment and drive behavior. Different behavioral contexts can significantly influence how these cortical regions process information and interact with each other. For instance, during locomotion, areas linked to motor control are activated to fine-tune limb positions due to obstacles in the environment, while sensory areas such as the visual cortex prioritize processing features that are more salient during locomotion (Schneider 2020). Understanding the dynamic interplay between cortical areas and behavior is crucial to comprehending how the brain processes sensory information and drives behavior.
Widefield optical imaging is an ideal technique to investigate brain-wide dynamics. The large field of view allows imaging of the entire mouse neocortex simultaneously, providing insights into how different cortical regions interact during behavior. This blog is the first in a two-part series where we analyze the cortical activity of a mouse during distinct stereotypical behaviors using widefield calcium imaging. In this part, we present the temporal profiles of cortical activity corresponding to different behaviors. In the second part, we will explore the interconnectivity of the different cortical areas.
The Experiment
Classification of Behavioral States
Upon visual inspection of the behavioral camera recording, the following stereotypical behaviors were observed:
- Locomotion
- Whisking
- Grooming
- Eye movement
The locomotion data was extracted from the treadmill encoder signal and classified into two categories: quiet and moving. The moving state was considered as treadmill speeds exceeding 5 mm/s, with forward and backward movements pooled together. The other behavioral categories (whisking, grooming, and eye gaze) were extracted from the behavioral camera frames. For the whisking and grooming classification, an ROI was drawn around the animal’s nose, and the average gradient of the pixel values inside the ROI was analyzed. Whisking behaviors were detected at changes exceeding 1 standard deviation (std) of the ROI data, while grooming corresponded to larger (> 2 std) variations. For the eye movements, gaze changes were calculated by fitting a circle over the pupil from the right eye and extracting the center coordinates of the circle for each frame. The differential of the Euclidean distances of the center coordinates was used, with a significant shift in eye gaze considered as pixel changes greater than 2 std. The whisking, grooming, and eye gaze changes were considered only during the quiet period.
Calcium Imaging Data Processing
The calcium signals were pre-processed by first removing the global variance (global signal regression) and then normalized so the pixel values are expressed as DeltaF/F. Finally, the calcium data was split by each behavioral state event trial. Each trial consisted of a baseline period of 0.5s and a post-event onset period of 3s. The cortical activity was averaged across all trials from each behavioral state, and the results are summarized below.
Results
In this short experiment, we identified stereotypical behavioral states of a mouse simply by analyzing the content of the behavioral camera and treadmill data. Even though not all states were completely dissociated in time, we observed distinct patterns of activation in the average cortical activity as a function of the behavioral state (see movie below). Given the spontaneity and complexity of some behaviors (e.g., grooming), cortical responses at periods more than a second or two after the event onset time tended to be variable across trials. However, focusing on the period between the event (i.e., behavioral state) onset and peak, some interesting patterns are noticeable.
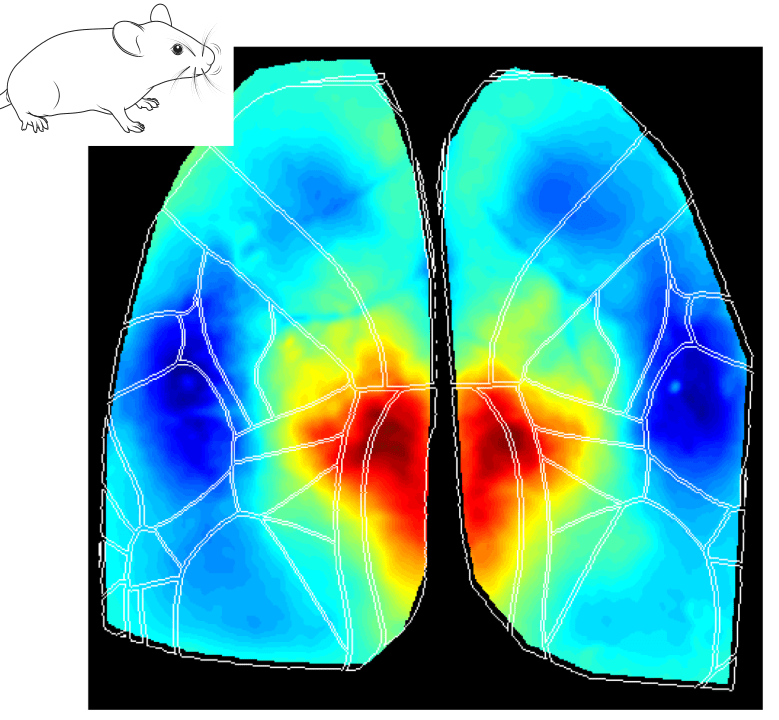
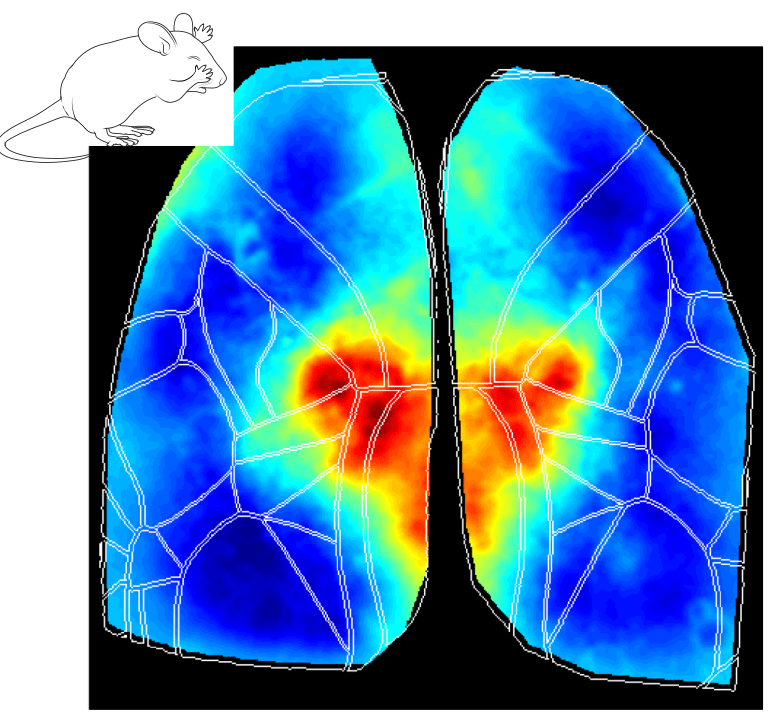
The Retrosplenial Area is Implicated in All Behavioral State Onsets
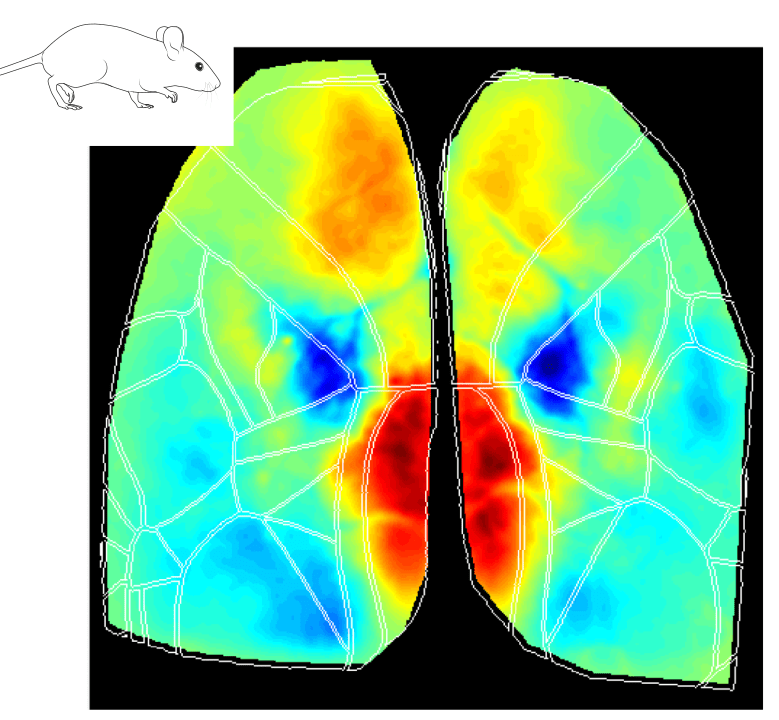
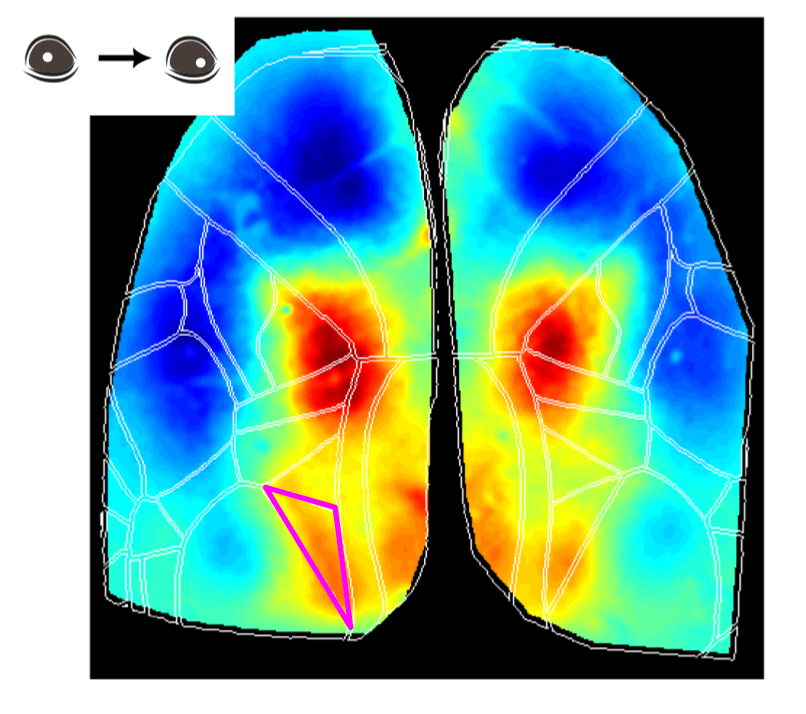
Interestingly, the Retrosplenial (RS) region is systematically activated in all behavioral states, and it seems to be the first cortical region to increase in activity at the event onset. The figures below show the average cortical activation map just before the state peak. One can see that the RS area is mostly activated during locomotion while it is less activated during eye movements.
Why does the RS cortex seem to be engaged in such distinct behavioral states? Early studies have suggested that the RS cortex plays a central role in spatial learning and memory, which are important for animal navigation (Vann, Aggleton, and Maguire 2009; Campagner et al. 2023; van der Goes et al. 2024). One could argue that different behaviors (e.g. locomotion, whisking and eye movements) are part of the mouse resources to navigate and explore the environment. For instance, the act of whisking and eye movements updates the animal’s internal representation of the environment while the animal moves around to explore it. Thus, the activation of the RS cortex in all different aspects of the broader spatial navigation behavior is in line with the idea that this area is a key element in the cortical network dedicated to navigation.
Higher-Order Visual Areas (HVAs) Are Activated During Eye Movements
Another interesting observation is that during the eye movement trials, a putative higher-order visual area was activated at the event peak (see figure above), the posterior-medial (PM) visual cortex. Although the specific roles of HVAs in distinct behavioral contexts are not fully understood, studies have suggested that the PM area may contribute to tracking objects in the visual field, for example (Andermann et al. 2011).
Final Remarks
This experiment highlights the advantages of widefield optical imaging in awake, behaving mice, showcasing its ability to reveal the dynamic interplay of cortical activity and behavior. With a simple experimental setup, one can extract interesting and meaningful information about the neuronal mechanisms underlying different behavioral states. This approach is one of many used to investigate how different cortical regions interact and respond to distinct behavioral states. In the next part of this blog series, we will showcase how to assess the cortex functional connectivity.
Products Used


References
Andermann, Mark L., Aaron M. Kerlin, Demetris K. Roumis, Lindsey L. Glickfeld, and R. Clay Reid. 2011. “Functional Specialization of Mouse Higher Visual Cortical Areas.” Neuron 72 (6): 1025–39. https://doi.org/10.1016/j.neuron.2011.11.013.
Campagner, Dario, Ruben Vale, Yu Lin Tan, Panagiota Iordanidou, Oriol Pavón Arocas, Federico Claudi, A. Vanessa Stempel, et al. 2023. “A Cortico-Collicular Circuit for Orienting to Shelter during Escape.” Nature 613 (7942): 111–19. https://doi.org/10.1038/s41586-022-05553-9.
Goes, Marie-Sophie H. van der, Jakob Voigts, Jonathan P. Newman, Enrique H. S. Toloza, Norma J. Brown, Pranav Murugan, and Mark T. Harnett. 2024. “Coordinated Head Direction Representations in Mouse Anterodorsal Thalamic Nucleus and Retrosplenial Cortex.” eLife 13 (March):e82952. https://doi.org/10.7554/eLife.82952.
Schneider, David M. 2020. “Reflections of Action in Sensory Cortex.” Current Opinion in Neurobiology 64 (October):53–59. https://doi.org/10.1016/j.conb.2020.02.004.
Vann, Seralynne D., John P. Aggleton, and Eleanor A. Maguire. 2009. “What Does the Retrosplenial Cortex Do?” Nature Reviews Neuroscience 10 (11): 792–802. https://doi.org/10.1038/nrn2733.
Drawings used from SciDraw:
https://doi.org/10.5281/zenodo.3925903
https://doi.org/10.5281/zenodo.3925901
https://doi.org/10.5281/zenodo.3925915
https://doi.org/10.5281/zenodo.3925937
Don’t miss out! Subscribe to our newsletter for the latest blog updates.
We hope you found this post helpful! If you have any questions or need further information, feel free to reach out. We’re here to help!