Exploring Cerebrovascular Dynamics with Widefield Laser Speckle Contrast Imaging
What Is Laser Speckle Contrast Imaging?
Up until now in our blog series, we explored several ways to probe brain function. Some of the techniques made possible with our LightTrack OiS200 include intrinsic signals, autofluorescence and calcium imaging. These techniques aim to assess neuronal function either directly (e.g. calcium imaging) or indirectly by using metabolic expenditure (autofluorescence) or oxygen consumption (intrinsic imaging) as proxies to assess the underlying neuronal function.
In this blog, we will explore another imaging technique that uses a different approach to reveal the vascular structure and blood flow of the brain tissue: laser speckle contrast imaging.
The Technique
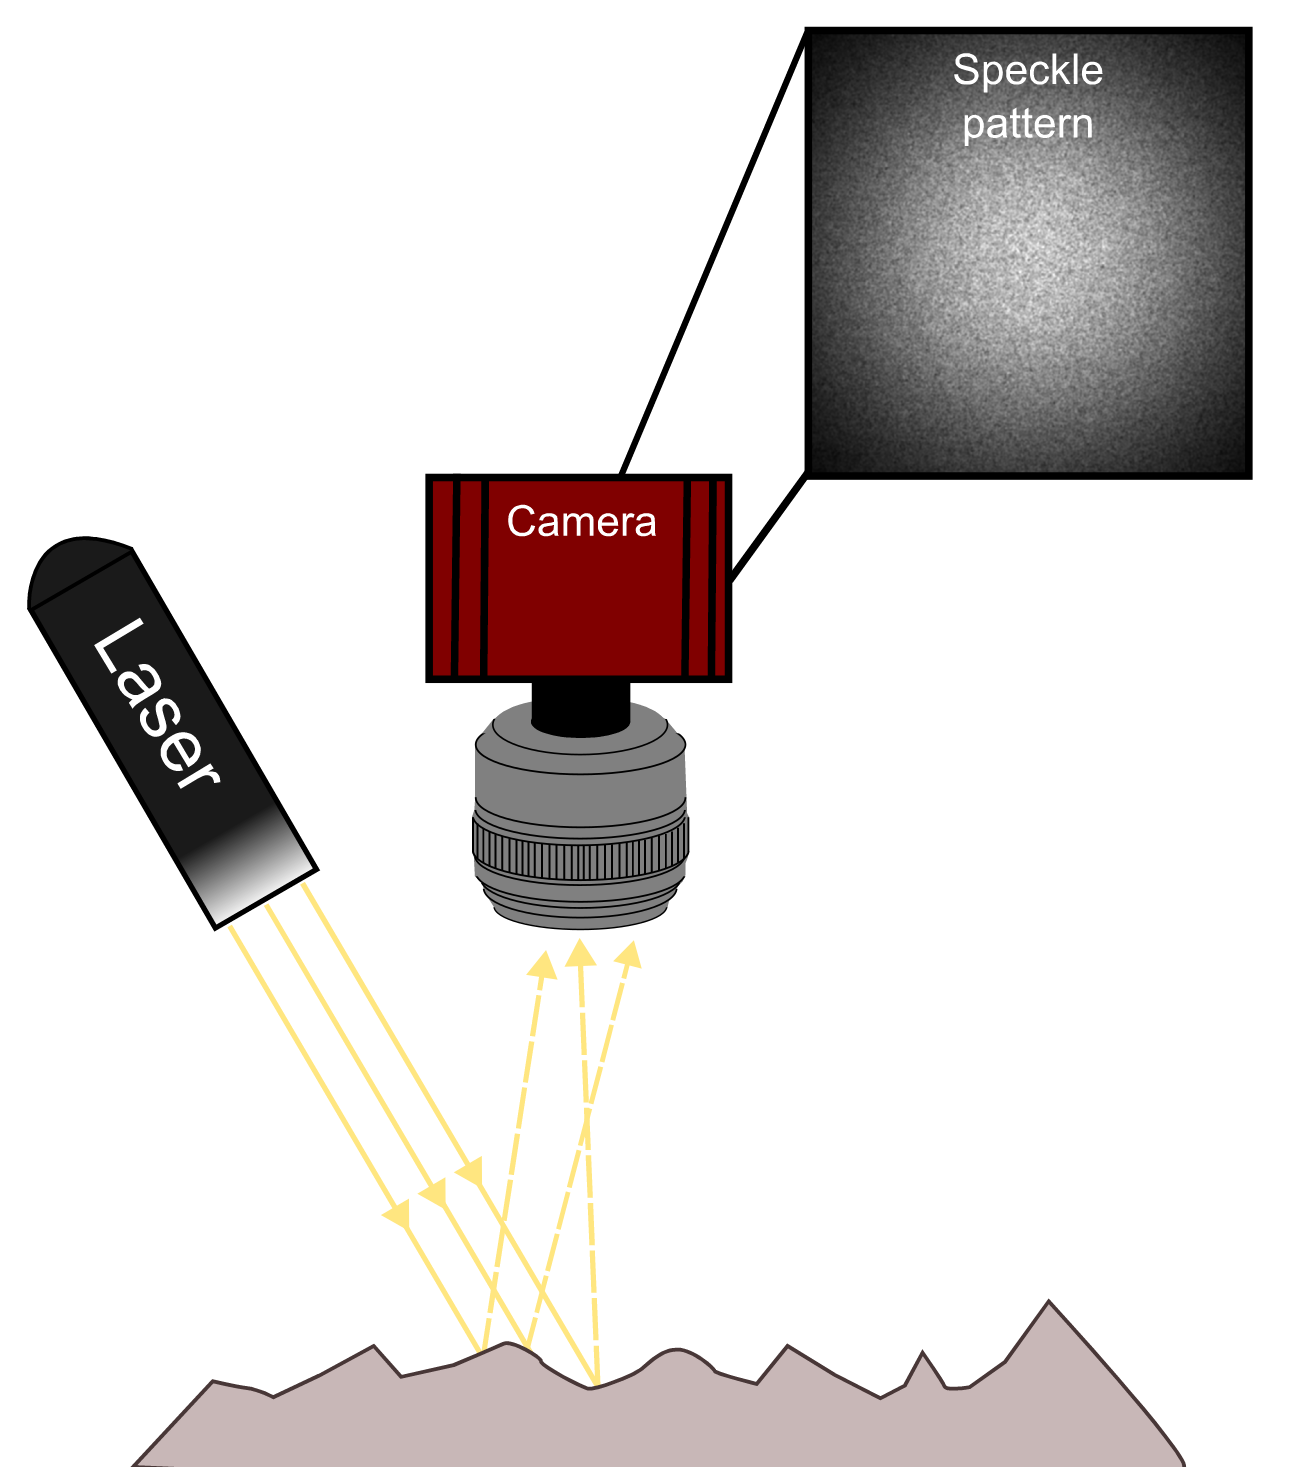
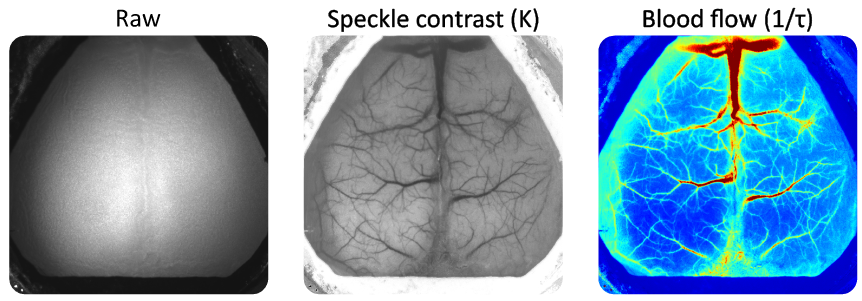
Laser Speckle Contrast Imaging (LSCI) is an imaging technique that enables the detection of particle flow (e.g. red blood cells) in a given medium (e.g. the brain). This technique is based on the interference of such moving particles on the speckle pattern detected by a camera. The speckle pattern arises from the interaction of a coherent light source (i.e. laser) with the illuminated tissue. In brief, the reflected laser light captured by the camera’s sensor has travelled different paths inside the tissue and the constructive and destructive sum of the light rays will create the random pattern in the image known as speckle.
How Can It Be Used to Infer Blood Flow?
In the context of imaging living tissue, red blood cells moving inside blood vessels will interfere with the speckle pattern. With a sufficiently long camera exposure time, the interference of the moving blood cells integrated in the captured image will appear as a blurring of the speckle pattern. Blood flow can then be inferred from the data by calculating the blurring level on the speckle pattern. This is represented by calculating the speckle contrast which is defined as the ratio of the standard deviation to the mean intensity of pixel values (see formula in Experiment section below). Generally, this algorithm can be applied spatially or temporally each with its own advantages and drawbacks (for more details, consult Boas and Dunn 2010; Dunn 2012).
How LSCI Is Used in Neurosciences?
Since the 1980s, laser speckle imaging has been used to visualize blood flow in different regions of the body. In the neurosciences field, LSCI has been widely used to investigate the physiological underpinnings of brain function. More specifically, when associated with other imaging modalities such as intrinsic and calcium imaging, LSCI is used to characterize the vascular component of neurovascular coupling and its pathological states. For instance, LSCI has been used to characterize the impairment of neurovascular coupling in a mouse model for Alzheimer’s disease (Tarantini et al. 2017). Other fields of study that leverage the use of LSCI include traumatic brain injury (Yan et al. 2022) and stroke research (Yin et al. 2022).
The Experiment
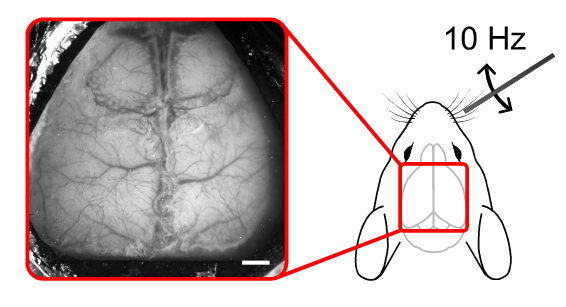
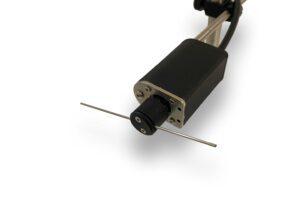
Our experiment was performed on a wild-type mouse under urethane anaesthesia. In brief, cortical responses in the left barrel cortex were recorded following whisker stimulation. The right whisker pad was stimulated using a metal rod attached to a Mechanical Whisker Stimulation device. The stimulation consisted of 10 Hz oscillations in the horizontal plane for 5 seconds, with a 20 second inter-stimulus period. Each trial was repeated 10 times. The speckle raw data were recorded using a 785 nm laser. Anatomical images were acquired under green (525 nm) illumination. Speckle images were acquired at 30 Hz with 5 ms exposure time using the OiS200 Light Track Imaging System.
Data Processing
Data processing was performed using umIT (Universal Mesoscale Imaging Toolbox), a user-friendly graphical user interface with a comprehensive set of functions for processing imaging datasets. The toolbox is open source and freely available on our GitHub repository: https://github.com/LabeoTech/Umit. Detailed documentation and tutorials can be found on the wiki page: https://labeotech.github.io/Umit/.
The following section explains the data processing steps, which were automatically performed by umIT.
Raw speckle images were transformed into speckle contrast using the formula:
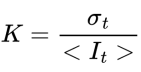
where K is the speckle contrast, σt is the standard deviation and It is the mean pixel intensity across a window of 15 frames (temporal algorithm). Cerebral blood flow was inferred from the speckle contrasts by calculating the inverse decorrelation time as:
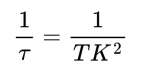
where τ is the decorrelation time, T is the camera’s exposure time and K is the speckle contrast (Ramirez-San-Juan et al. 2008). Then, the data were binned temporally to 10 Hz, split by trials, normalized by the median of the pre-stimulus onset period and spatially filtered using a Gaussian filter (Matlab’s imgaussfilt, sigma = 3).
Results
The video below shows the average increase of the blood flow at the left somatosensory cortex following contralateral whisker pad stimulation.
Average blood flow variation following stimulation of the right whisker pad. Blood flow variations are presented as an overlay on top of the static speckle contrast map. The inset plot shows the temporal dynamics of the average pixels within the red circle. The blue region represents the stimulation period. This movie was cropped to 10s post-stimulus onset.
Summary and Insights
In this blog post, we showcased one of the multiple uses for laser speckle contrast imaging. This technique has been increasingly relevant in research settings as well as a clinical tool. Given the simple setup and the lack of labels or contrast agents, laser speckle contrast imaging remains a versatile imaging technique that can be easily implemented in a range of studies not only in neurosciences but also in other fields that require the assessment of blood flow.
Products Used

References
Boas, David A., and Andrew K. Dunn. 2010. “Laser Speckle Contrast Imaging in Biomedical Optics.” Journal of Biomedical Optics 15 (1): 011109. https://doi.org/10.1117/1.3285504.
Dunn, Andrew K. 2012. “Laser Speckle Contrast Imaging of Cerebral Blood Flow.” Annals of Biomedical Engineering 40 (2): 367–77. https://doi.org/10.1007/s10439-011-0469-0.
Ramirez-San-Juan, Julio C., Ruben Ramos-Garcia, Ileana Guizar-Iturbide, Gabriel Martinez-Niconoff, and Bernard Choi. 2008. “Impact of Velocity Distribution Assumption on Simplified Laser Speckle Imaging Equation.” Optics Express 16 (5): 3197–203. https://doi.org/10.1364/OE.16.003197.
Tarantini, Stefano, Gabor A. Fulop, Tamas Kiss, et al. 2017. “Demonstration of Impaired Neurovascular Coupling Responses in TG2576 Mouse Model of Alzheimer’s Disease Using Functional Laser Speckle Contrast Imaging.” GeroScience 39 (4): 465–73. https://doi.org/10.1007/s11357-017-9980-z.
Yan, Jin, Yuan Zhang, Lin Wang, et al. 2022. “TREM2 Activation Alleviates Neural Damage via Akt/CREB/BDNF Signalling after Traumatic Brain Injury in Mice.” Journal of Neuroinflammation 19 (1): 289. https://doi.org/10.1186/s12974-022-02651-3.
Yin, Lu, Tengfei Yu, Linggang Cheng, et al. 2022. “Laser Speckle Contrast Imaging for Blood Flow Monitoring in Predicting Outcomes after Cerebral Ischemia-Reperfusion Injury in Mice.” BMC Neuroscience 23 (1): 80. https://doi.org/10.1186/s12868-022-00769-x.
Drawings used:
https://doi.org/10.5281/zenodo.3925903
Don’t miss out! Subscribe to our newsletter for the latest blog updates.
We hope you found this post helpful! If you have any questions or need further information, feel free to reach out. We’re here to help!