Improving Probe Targeting Accuracy in Mouse Cortex Using Optical Imaging
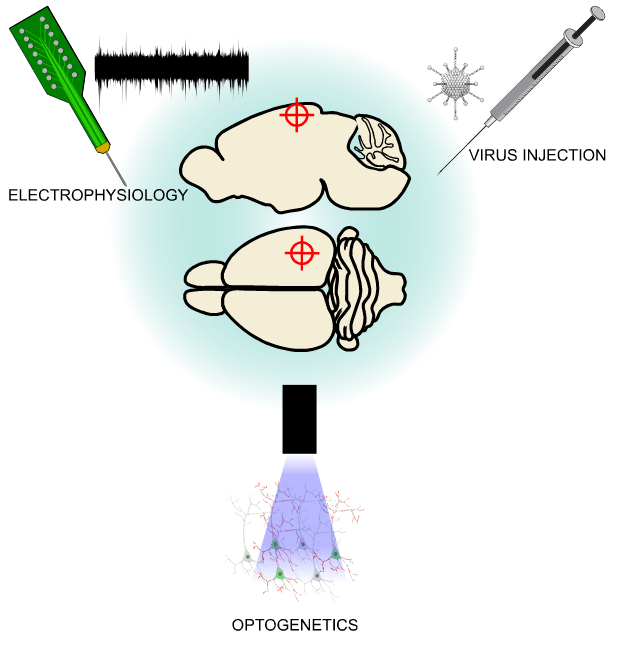
In neuroscience, precise targeting of specific cortical regions is crucial for various methodological approaches. These include electrophysiological recordings, the injection of tracers, and the delivery of viral vectors to study the brain’s structure and function. Traditionally, these methods rely on anatomical atlases with stereotaxic coordinates to locate the target region and post-mortem validation of the recording/injection sites. This approach, while invaluable, sometimes falls short of achieving the desired precision. For instance, natural variations in brain size and position relative to classical landmarks (e.g., Bregma) can lead to missed targets. This issue is frequently observed in mice, where targeted regions can be very small, leading to higher error rates.

How Optical Imaging Can Help?
With a large field of view and high spatial (around 10 microns) and temporal resolutions, optical imaging is an invaluable tool in neuroscience research. This minimally invasive technique has been used to investigate several aspects of brain function, including neuronal activity, cerebral blood flow, and neurovascular coupling. Another common usage of the technique leverages its high spatial resolution to map cortical regions dedicated to processing specific sensory stimuli. This functional mapping approach has been used to delineate several regions of the mouse cortex, including the visual (Juavinett et al. 2017; Zhuang et al. 2017), somatosensory (Knutsen, Mateo, and Kleinfeld 2016), and auditory (Romero et al. 2020) areas.
Functional mapping provides a significant advantage compared to atlas-based approaches because it allows for the creation of a cortical map for each individual mouse. These maps can then be used to target cortical regions for electrophysiology or microinjections with greater precision. In a recent paper, Mocanu and Shmuel (2021) demonstrated this by using intrinsic optical imaging to map specific regions in the barrel field processing inputs from a single whisker. They then used this information to target a pipette for virus injections and a laminar electrode. In this blog, we describe a similar procedure where we perform retinotopic mapping to reveal and target a higher-order visual area (HVA) for electrophysiological recordings.
The Experiment
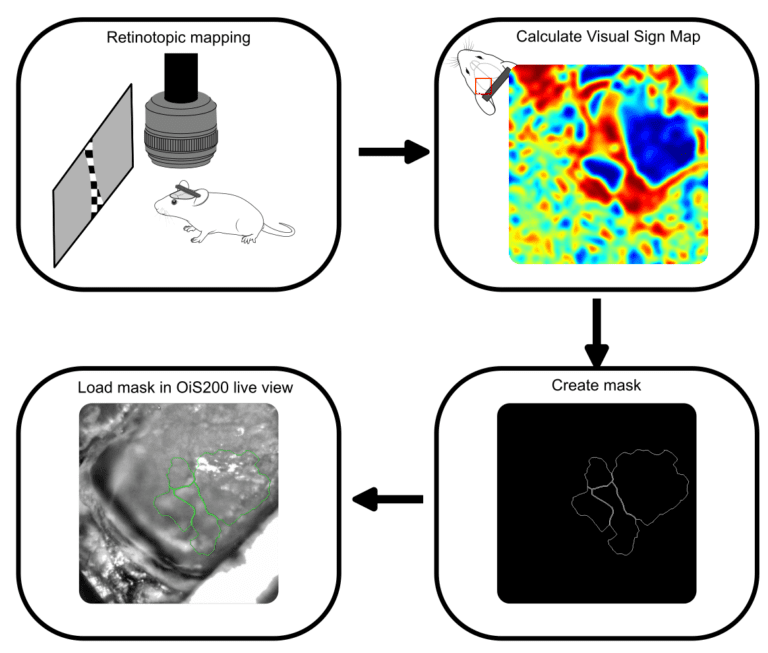
Our experiment was performed on an anesthetized mouse expressing the calcium indicator jrGECO and the optogenetic probe channelrhodopsin in cortical excitatory neurons. The cortical images were acquired using our OiS200 LightTrack Imaging device under 565 nm illumination. The retinotopic mapping was undertaken using the methods described by Zhuang et al. (2017) and shown in our previous blog on that subject. The calcium signals were processed using the umIToolbox. First, the global oscillations were removed from the signal, then the data was analyzed in the Fourier domain to extract the azimuth and elevation phase maps, which were then used to calculate the visual sign map to reveal the boundaries of the visual areas. The map was then segmented, and a mask image file was created to be used as a guide during the rest of the procedure.

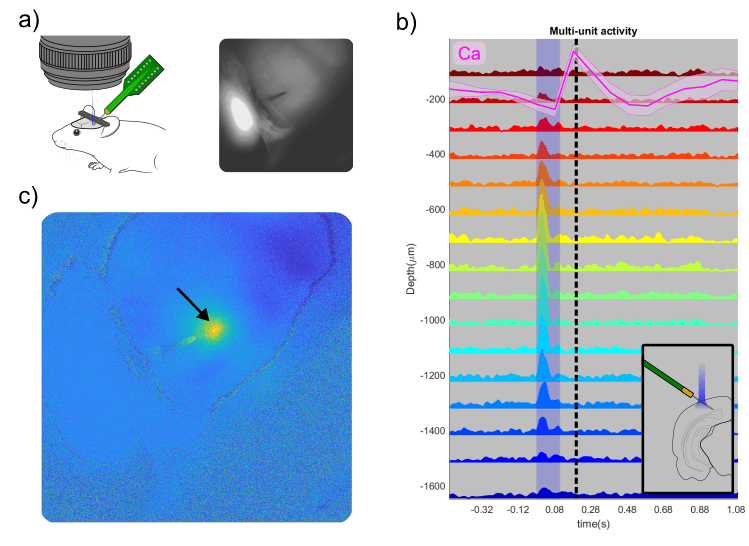
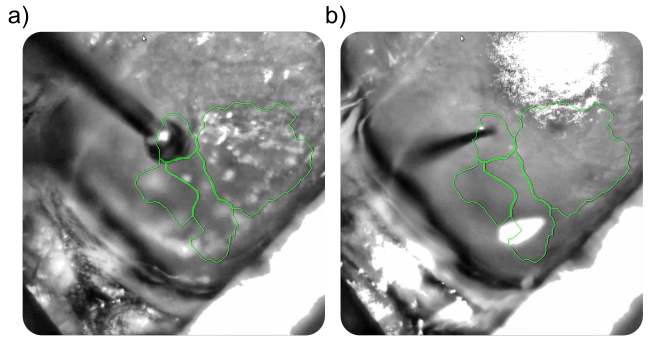
The mask file was overlaid on the live view of the OiS200 LightTrack acquisition software (Figure above) and used to locate the drilling site and guide a laminar electrode insertion into the cortex (see figure below). The multi-unit activity was recorded using OpenEphys. Neuronal responses in the vicinity of the laminar electrode were acquired following optogenetic stimulation using the system’s add-on 2D Illumination Scanning device with a 450 nm laser.
Results
The visual sign map extracted from the retinotopic mapping shows the borders of the primary visual cortex and at least three putative HVAs: RL, AL, and LM. We then targeted the RL region for the electrophysiological recordings. The optogenetic stimulation yielded reliable responses at the recorded site, as shown in the figure below.

Summary and Insights
This experiment demonstrates how optical imaging can be leveraged to increase the accuracy of other methods, such as electrophysiological recordings and targeted microinjections. With this extended application of the optical imaging technique, researchers can easily generate individualized cortical maps and overcome the limitations of traditional atlas-based approaches. Moreover, the ease of use of our OiS200 LightTrack system, particularly with the mask overlay feature, simplifies the process of locating and targeting specific functionally defined cortical areas.
Products Used
References
Juavinett, Ashley L., Ian Nauhaus, Marina E. Garrett, Jun Zhuang, and Edward M. Callaway. 2017. “Automated Identification of Mouse Visual Areas with Intrinsic Signal Imaging.” Nature Protocols 12 (1): 32–43. https://doi.org/10.1038/nprot.2016.158.
Knutsen, Per M., Celine Mateo, and David Kleinfeld. 2016. “Precision Mapping of the Vibrissa Representation within Murine Primary Somatosensory Cortex.” Philosophical Transactions of the Royal Society of London. Series B, Biological Sciences 371 (1705): 20150351. https://doi.org/10.1098/rstb.2015.0351.
Mocanu, Victor M., and Amir Shmuel. 2021. “Optical Imaging-Based Guidance of Viral Microinjections and Insertion of a Laminar Electrophysiology Probe Into a Predetermined Barrel in Mouse Area S1BF.” Frontiers in Neural Circuits 15:541676. https://doi.org/10.3389/fncir.2021.541676.
Romero, Sandra, Ariel E Hight, Kameron K Clayton, Jennifer Resnik, Ross S Williamson, Kenneth E Hancock, and Daniel B Polley. 2020. “Cellular and Widefield Imaging of Sound Frequency Organization in Primary and Higher Order Fields of the Mouse Auditory Cortex.” Cerebral Cortex (New York, NY) 30 (3): 1603–22. https://doi.org/10.1093/cercor/bhz190.
Zhuang, Jun, Lydia Ng, Derric Williams, Matthew Valley, Yang Li, Marina Garrett, and Jack Waters. 2017. “An Extended Retinotopic Map of Mouse Cortex.” Edited by David Kleinfeld. eLife 6 (January):e18372. https://doi.org/10.7554/eLife.18372.
Drawings used:
https://doi.org/10.5281/zenodo.7679042
https://doi.org/10.5281/zenodo.5749462
adeno-virus icon by Servier https://smart.servier.com/ is licensed under CC-BY 3.0 Unported https://creativecommons.org/licenses/by/3.0/
https://doi.org/10.5281/zenodo.3925905
https://doi.org/10.5281/zenodo.3925987
https://doi.org/10.5281/zenodo.3925901
https://doi.org/10.5281/zenodo.3925903
Don’t miss out! Subscribe to our newsletter for the latest blog updates.
We hope you found this post helpful! If you have any questions or need further information, feel free to reach out. We’re here to help!


